Select Page

Criminal Cases & Jury Trial Statistics

The statistics displayed were extracted from the Yolo County District Attorney’s Office’s Case Management System and analyzed by the Yolo County District Attorney’s Office. The 2017 statistics involving the Public Defender’s Office were determined in collaboration with the Yolo County Public Defender’s Office. Some of these cases were initiated and/or filed by the District Attorney’s Office in a previous year. For example, a defendant may be arrested in 2016, but that defendant may not have his or her first court appearance until 2017. In this scenario, the case would be a new case for the District Attorney’s Office in 2016 and a new case for the Public Defender’s Office in 2017. Because of this, the case in this scenario would not be reflected in the 2017 Criminal Cases statistics for Felony and Misdemeanor cases (since it was a 2016 DA case).

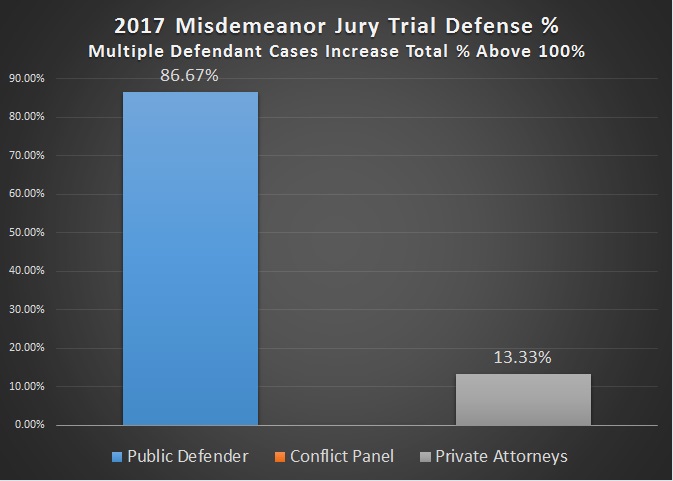
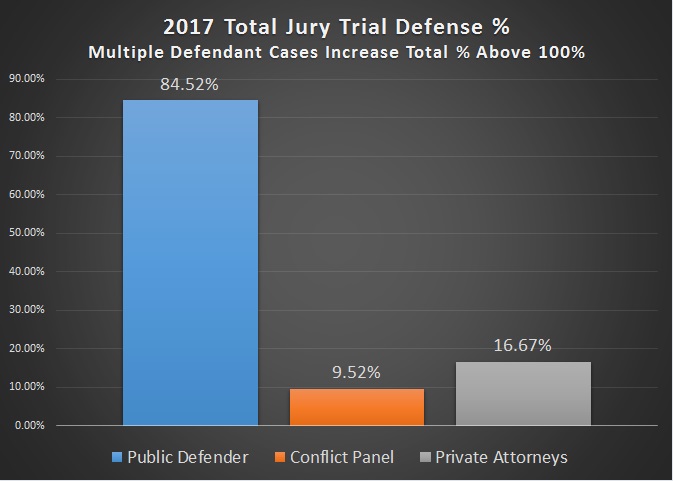
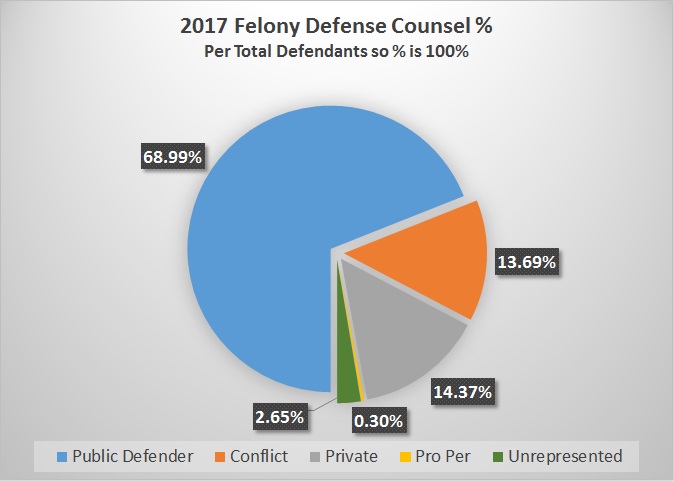
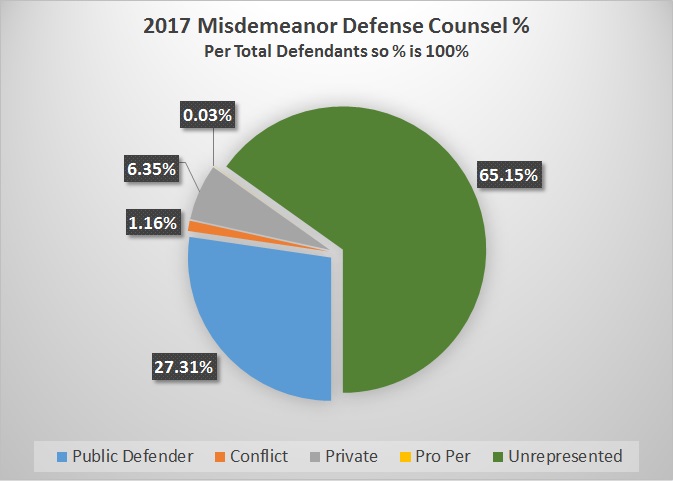
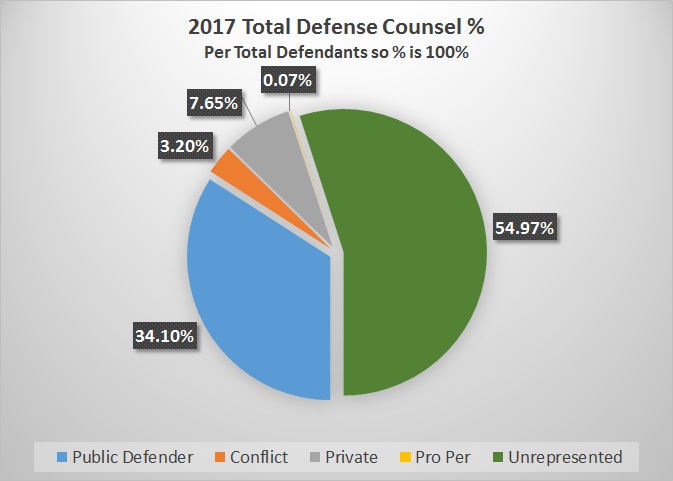
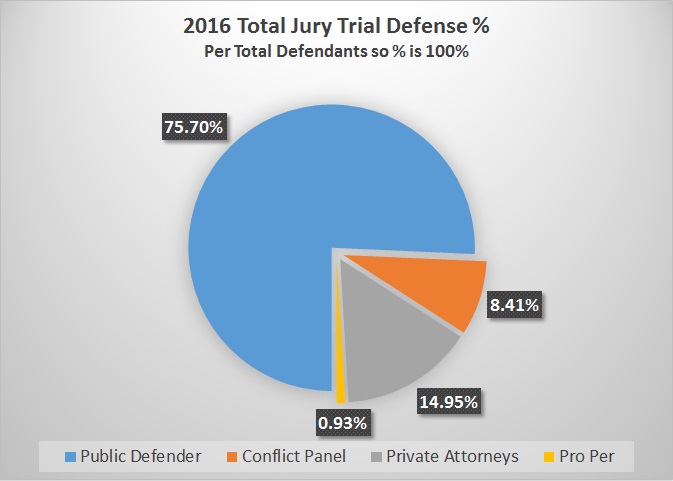
Some cases involve multiple defendants. In such cases, more than one defense counsel is needed. For example, the Public Defender’s Office cannot, except in rare circumstances, represent more than one defendant/client in a single criminal case. Such scenarios create a “conflict” that requires appointment of counsel from the Conflicts Panel or the defendant retaining a private attorney. Because of this, the number of defense counsel exceeds the number of cases filed by the District Attorney’s Office and the total percentages in the case bar graphs exceed 100%. For example, a case involving 5 defendants could have defense counsel from the Public Defender’s Office, Conflict Panel, and Private Attorneys. Each of these defense counsel would be reflected in the 2017 Defense Counsel % statistics. The bar graphs show the percentage of cases where the defense counsel was involved; however, the pie charts are a percentage based off the total defendants.

In 2017, there was 1 Misdemeanor Jury Trial that was prosecuted by the Attorney General’s Office.

Public Defender: Represented by an attorney from the Yolo County Public Defender’s Office.

Conflict: Represented by an attorney from the Conflict Panel.

Private: Represented by a Private Attorney.

Pro Per: The defendant represents himself/herself.

Unrepresented: No formal defense counsel was appointed, or the defendant has not appeared in court.

These statistics were updated on April 20, 2018. As cases are updated, these statistics can change.

2017 Felony & Misdemeanor Statistics
Based on Criminal Case Count (Total Percentages Above 100% – Full Explanation Above)

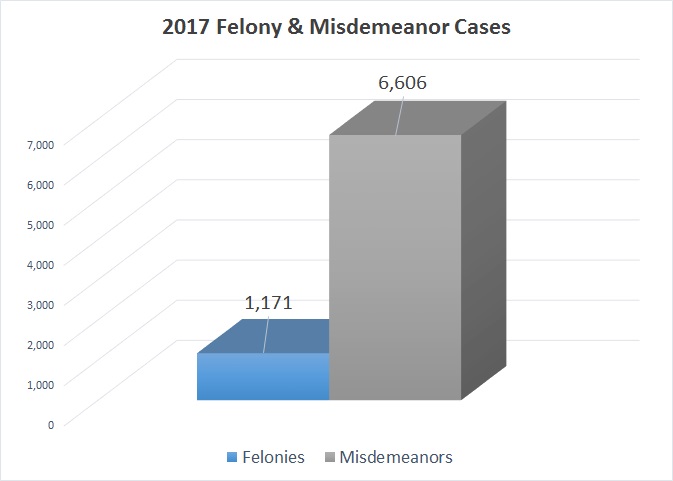
Felonies: 1,171 | Misdemeanors: 6,606 | Total: 7,777

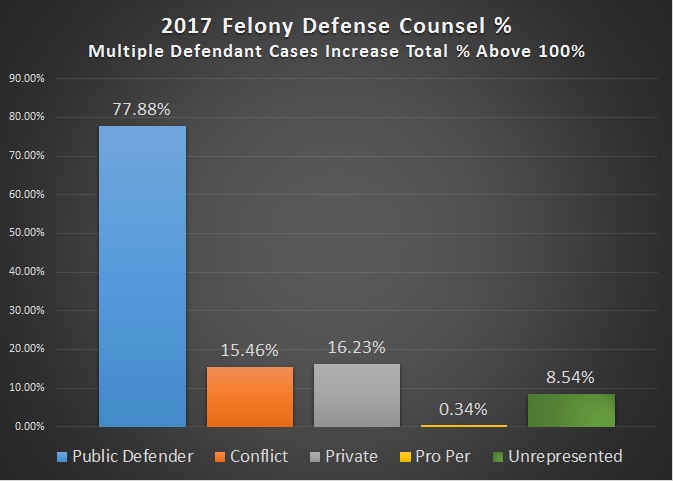
Public Defender: 912 (77.88%) | Conflict Panel: 181 (15.46%) | Private Attorney: 190 (16.23%) | Pro Per: 4 (0.34%)

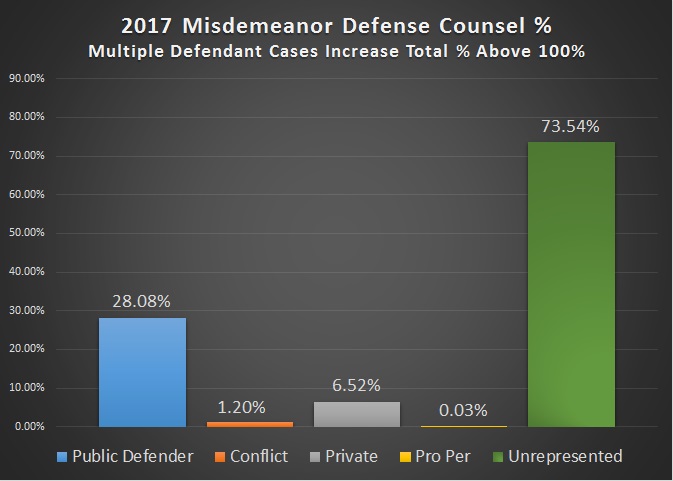
Public Defender: 1,855 (28.08%) | Conflict Panel: 79 (1.20%) | Private Attorney: 431 (6.52%) | Pro Per: 2 (0.03%)

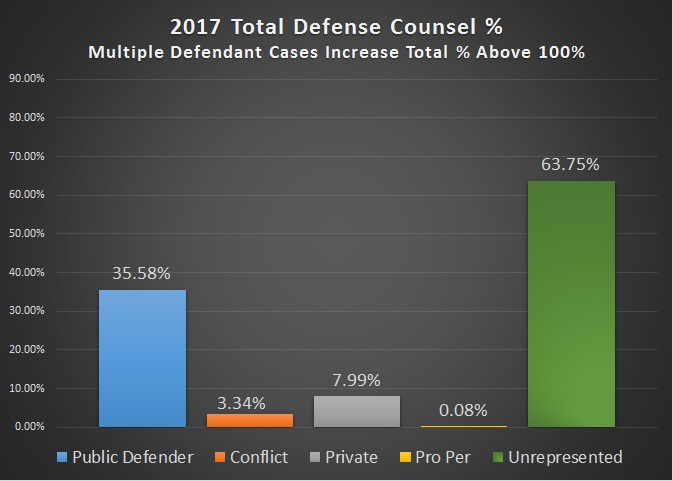
Public Defender: 2,767 (35.58%) | Conflict Panel: 260 (3.34%) | Private Attorney: 621 (7.99%) | Pro Per: 6 (0.08%)

Felonies: 54 | Misdemeanors*: 30 | Total: 84
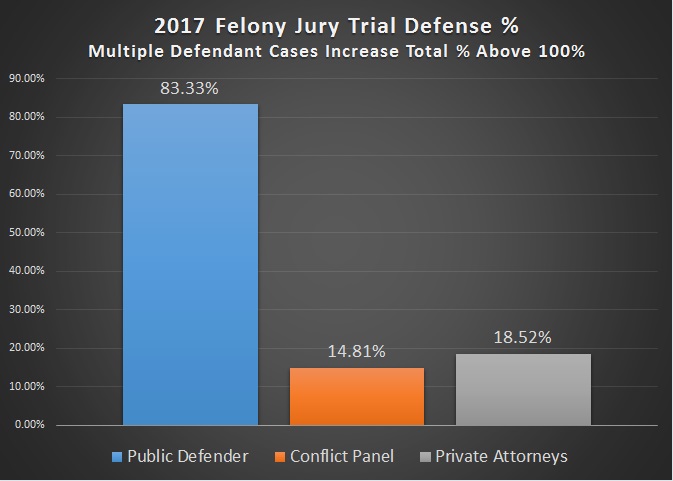
Public Defender: 45 (83.33%) | Conflict Panel: 8 (14.81%) | Private Attorney: 10 (18.52%)
Public Defender: 26 (86.67%) | Conflict Panel: 0 (0.00%) | Private Attorney: 4 (13.33%)
Public Defender: 71 (84.52%) | Conflict Panel: 8 (9.52%) | Private Attorney: 14 (16.67%)

*There was 1 Misdemeanor Case prosecuted by the Attorney General’s Office.

Based on Criminal Defendant Count
Felonies: 1,322 | Misdemeanors: 6,792 | Total: 8,114
Public Defender: 912 (68.99%) | Conflict Panel: 181 (13.69%) | Private Attorney: 190 (14.37%) | Pro Per: 4 (0.30%)
Public Defender: 1,855 (27.31%) | Conflict Panel: 79 (1.16%) | Private Attorney: 431 (6.35%) | Pro Per: 2 (0.03%)
Public Defender: 2,767 (34.10%) | Conflict Panel: 260 (3.20%) | Private Attorney: 621 (7.65%) | Pro Per: 6 (0.07%)
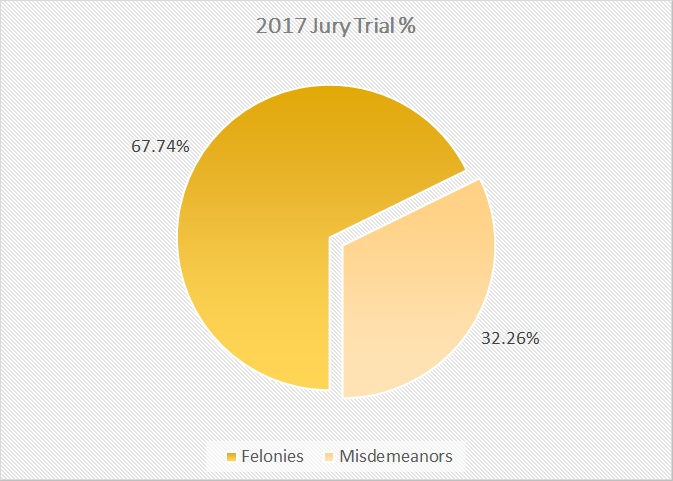
Felonies: 63 | Misdemeanors: 30 | Total: 93
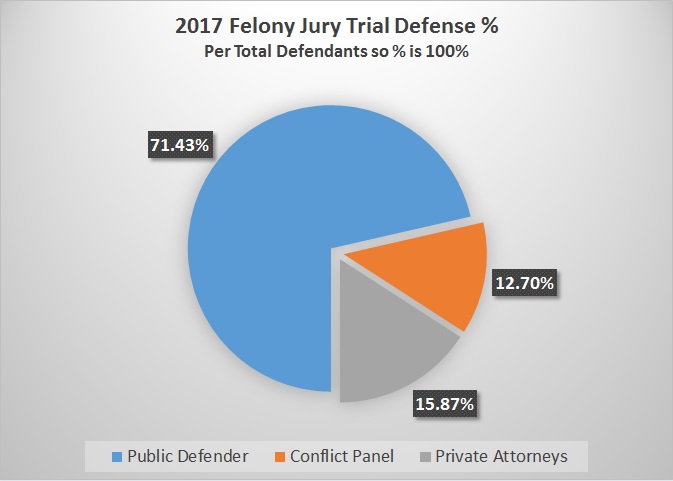
Public Defender: 45 (71.43%) | Conflict Panel: 8 (12.70%) | Private Attorney: 10 (15.87%)
Public Defender: 26 (86.67%) | Conflict Panel: 0 (0.00%) | Private Attorney: 4 (13.33%)
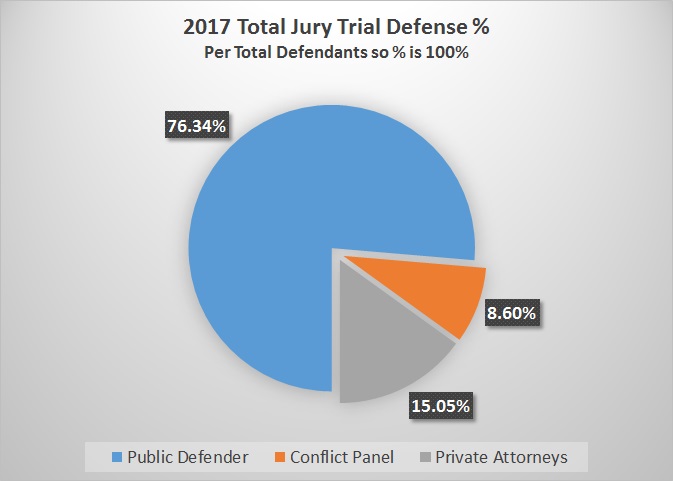
Public Defender: 71 (76.34%) | Conflict Panel: 8 (8.60%) | Private Attorney: 14 (15.05%)
2016 Felony & Misdemeanor Statistics
Based on Criminal Case Count (Total Percentages Above 100% – Full Explanation Above)
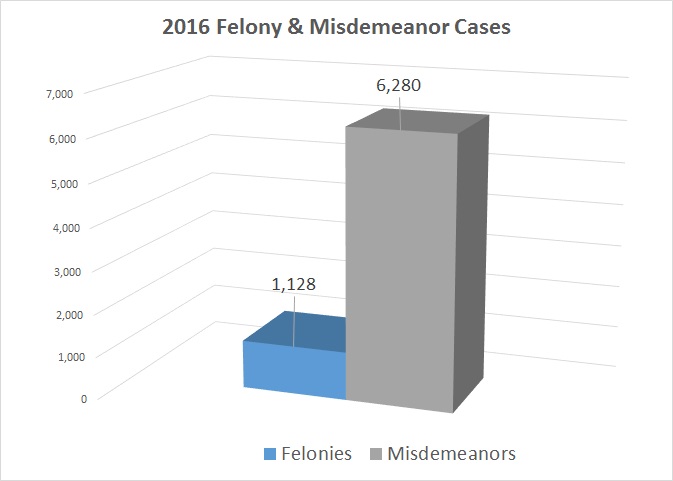
Felonies: 1,128 | Misdemeanors: 6,280 | Total: 7,408
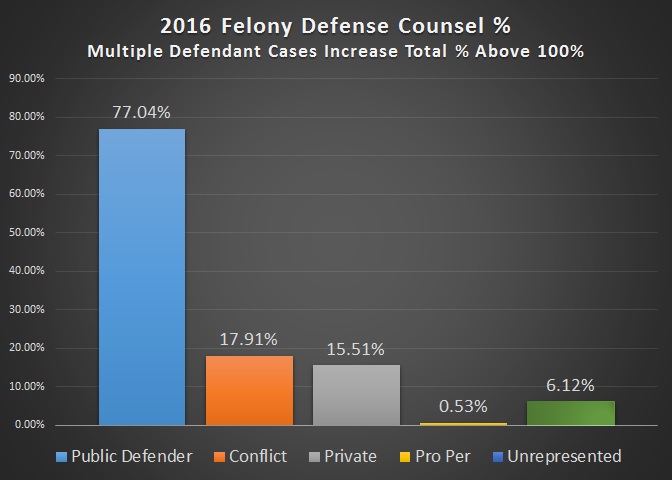
Public Defender: 869 (77.04%) | Conflict Panel: 202 (17.91%) | Private Attorney: 175 (15.51%) | Pro Per: 6 (0.53%)
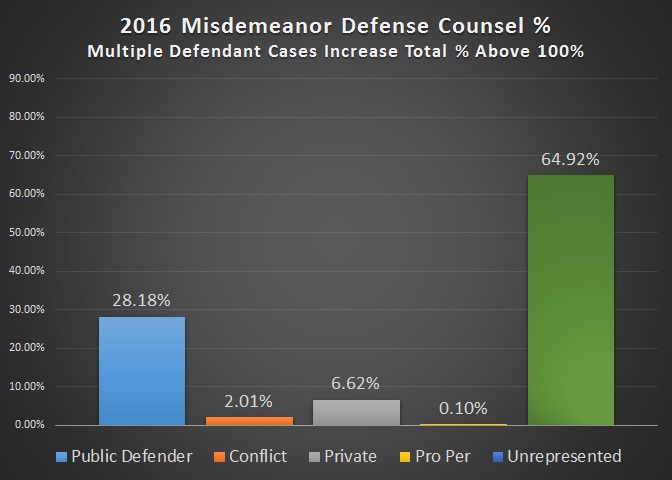
Public Defender: 1,770 (28.18%) | Conflict Panel: 126 (2.01%) | Private Attorney: 416 (6.62%) | Pro Per: 6 (0.10%)
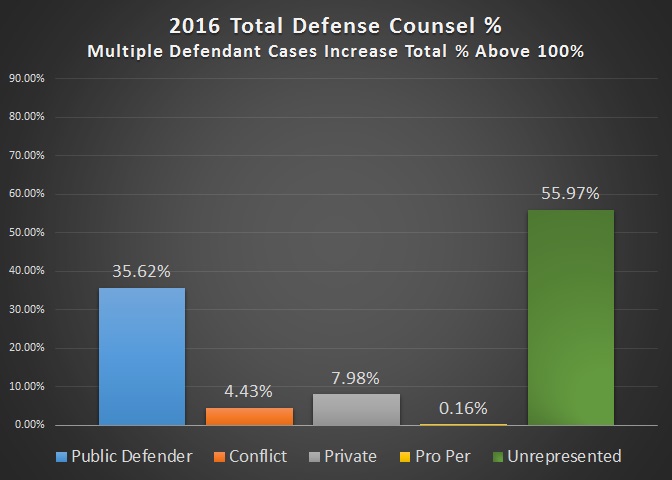
Public Defender: 2,639 (35.62%) | Conflict Panel: 328 (4.43%) | Private Attorney: 591 (7.98%) | Pro Per: 12 (0.16%)
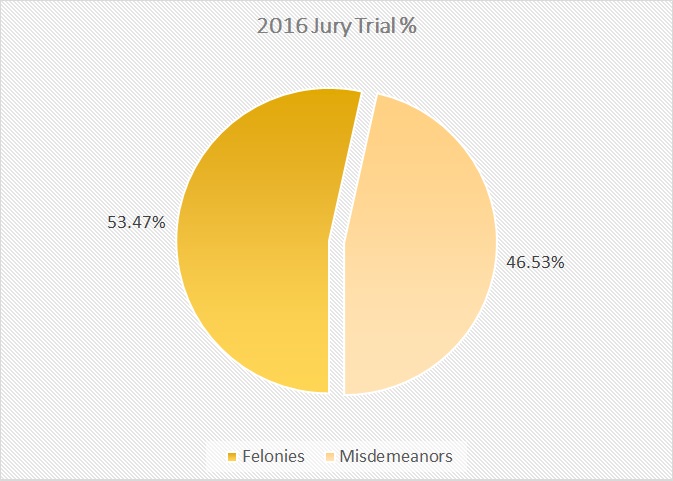
Felonies: 54 | Misdemeanors: 47 | Total: 101
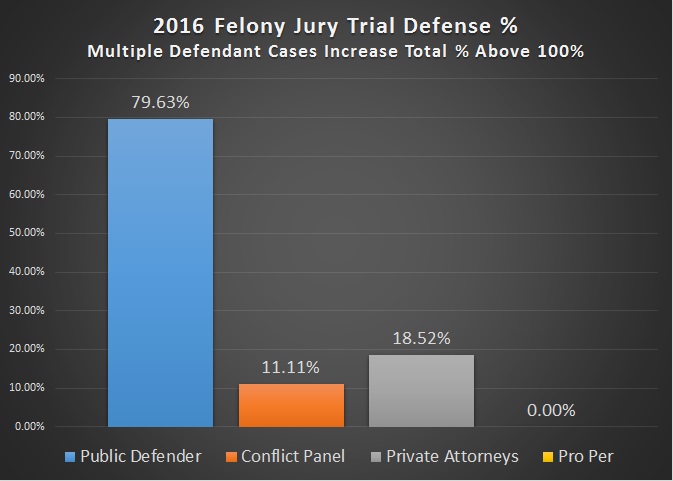
Public Defender: 43 (79.63%) | Conflict Panel: 6 (11.11%) | Private Attorney: 10 (18.52%) | Pro Per: 0 (0.00%)
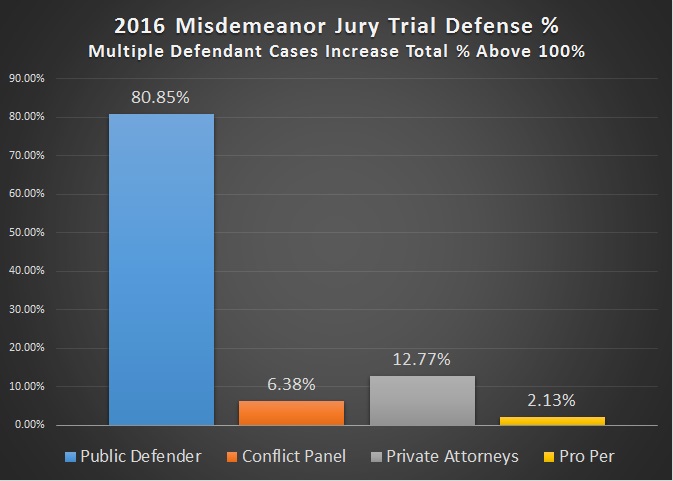
Public Defender: 38 (80.85%) | Conflict Panel: 3 (6.38%) | Private Attorney: 6 (12.77%) | Pro Per: 1 (2.13%)
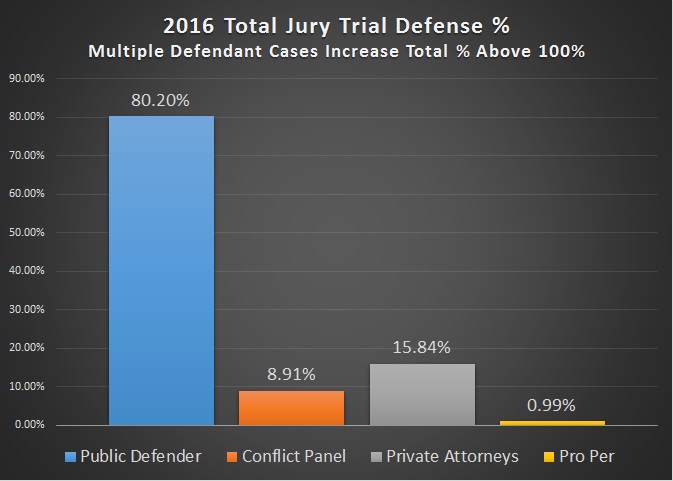
Public Defender: 81 (80.20%) | Conflict Panel: 9 (8.91%) | Private Attorney: 16 (15.84%) | Pro Per: 1 (0.99%)
Based on Criminal Defendant Count
Felonies: 1,328 | Misdemeanors: 6,468 | Total: 7,796
Public Defender: 869 (65.44%) | Conflict Panel: 202 (15.21%) | Private Attorney: 175 (13.18%) | Pro Per: 6 (0.45%)
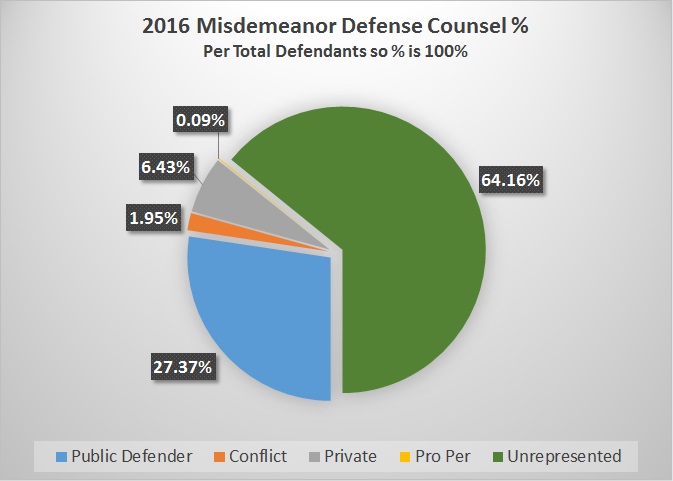
Public Defender: 1,770 (27.37%) | Conflict Panel: 126 (1.95%) | Private Attorney: 416 (6.43%) | Pro Per: 6 (0.09%)
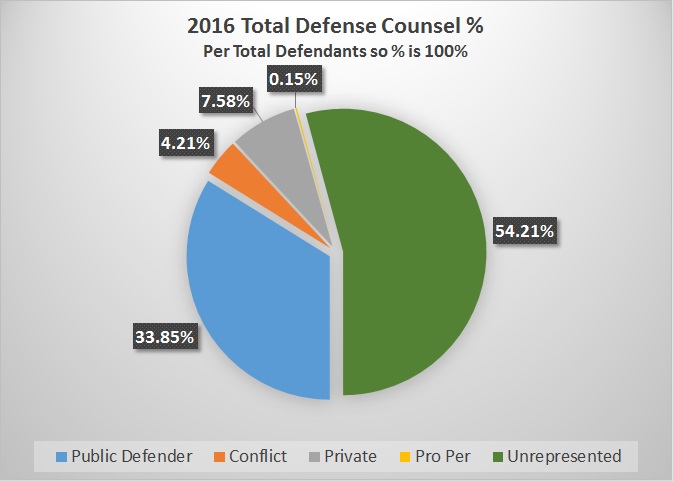
Public Defender: 2,639 (33.85%) | Conflict Panel: 328 (4.21%) | Private Attorney: 591 (7.58%) | Pro Per: 12 (0.15%)
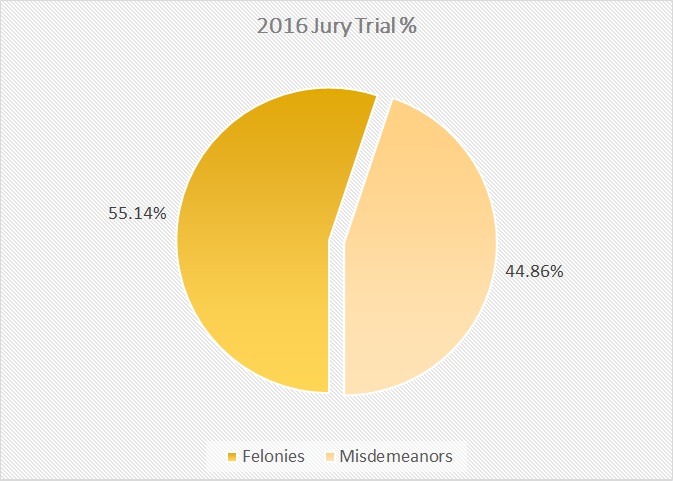
Felonies: 59 | Misdemeanors: 48 | Total: 107
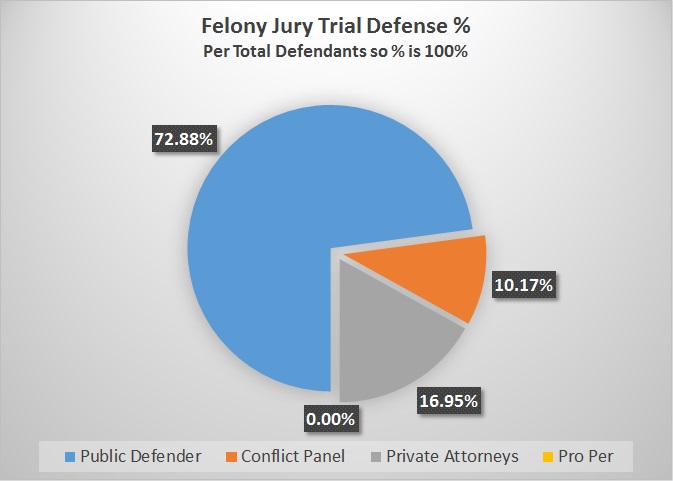
Public Defender: 43 (72.88%) | Conflict Panel: 6 (10.17%) | Private Attorney: 10 (16.95%) | Pro Per: 0 (0.00%)
Public Defender: 38 (79.17%) | Conflict Panel: 3 (6.25%) | Private Attorney: 6 (12.50%) | Pro Per: 1 (2.08%)
Public Defender: 81 (75.70%) | Conflict Panel: 9 (8.41%) | Private Attorney: 16 (14.95%) | Pro Per: 1 (0.93%)
All inquiries regarding these statistics can be sent to district.attorney@yolocounty.org